The I-Opt Map
@tags:: #lit✍/📰️article/highlights
@links::
@ref:: The I-Opt Map
@author:: oeinstitute.org
=this.file.name

Reference
=this.ref
Notes
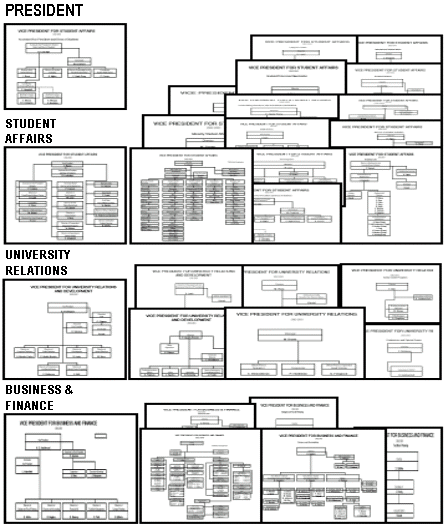
An organization chart is the traditional tool for "seeing" a firm. A partial example of a set of charts is shown in Graphic 1. These charts are useful Human Resource records, but they fail as a way of assessing a firm as a whole. The webs of relationships existing between any two points in an organization are lost in the detail. The chart only describes the chain of command. The nature of the interactions up and down that chain is ignored.
- View Highlight
- 1idea, learning,
- [note::Org charts document chain of command. They do not document patterns of interactions (ideal or in actuality) or related concepts, such as power, influence, or collaborative excellence.
Could you use network aanaly]
- View Highlight
-
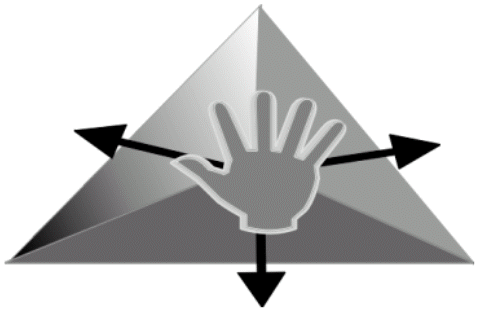
(highlight:: Graphic 2 - Symbolic Organizational Representation
 )
)
- View Highlight
-
(highlight:: Graphic 3 - Solid Organizational Representation
 )
)
- View Highlight
-
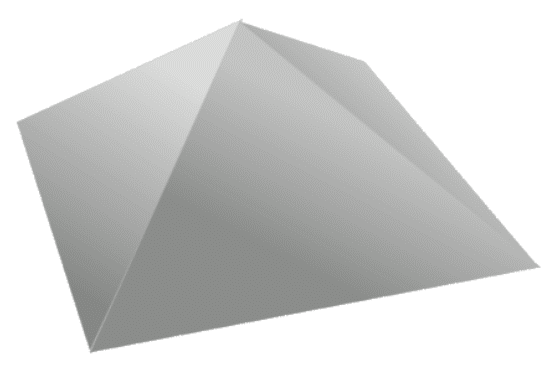
(highlight:: Graphic 5 - Collapsing the Pyramid
 )
)
- View Highlight
-
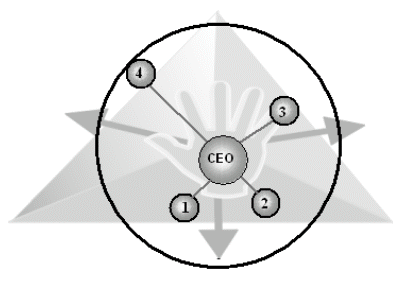
(highlight:: Graphic 6 - Direct CEO Reports
 )
)
- View Highlight
-
Not all of the CEO's direct reports "squirt" out the same distance. Some are close, some are far. The distance from the CEO is set by the frequency of interaction. The underlying idea is that a person cannot have an effect unless they have an opportunity to transmit their perspective. The more often they interact, the greater the opportunity.
- View Highlight
-
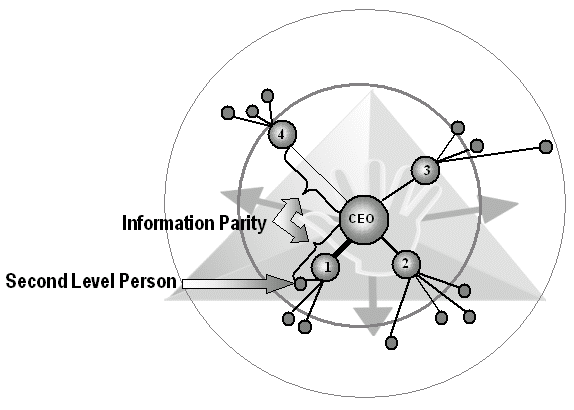
(highlight:: Graphic 7 - Second Level Reports
 )
)
- View Highlight
-
(highlight:: Graphic 8 - Completed Compression
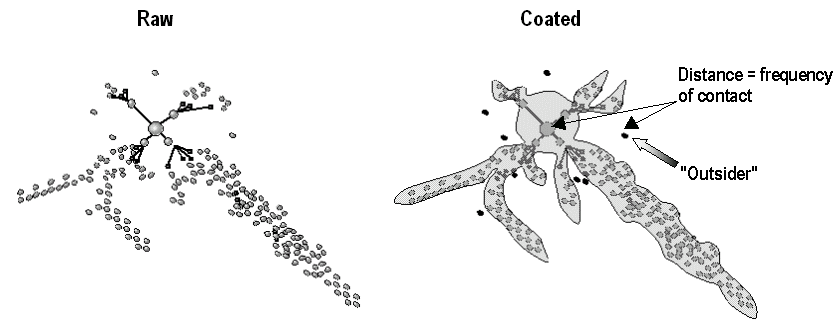
For example, the accounting staff lies toward the center of a tentacle. People in this function interact most often with other organizational insiders. The sales group, on the other hand, interacts with clients and has direct contact with the environment. Information flowing from people who lie on the edges (e.g., the sales group) are likely to contain raw data. It may be disjointe, but it is relatively without bias. People at the center of a tentacle (e.g., accountants) tend to use "second hand" data; however, because they are insulated from the turmoil of the environment, they can "digest" it into a focused and logical format. Recognizing the source and nature of this kind of difference can be important at both strategic and policy levels.)
- View Highlight
-
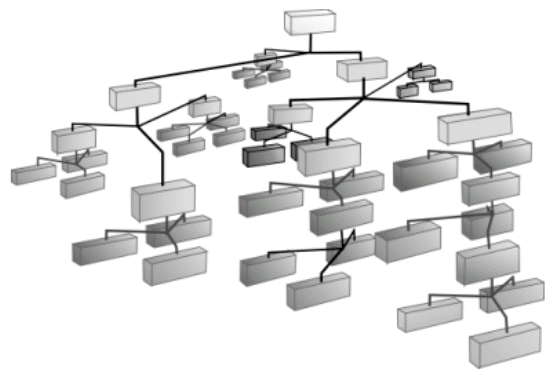
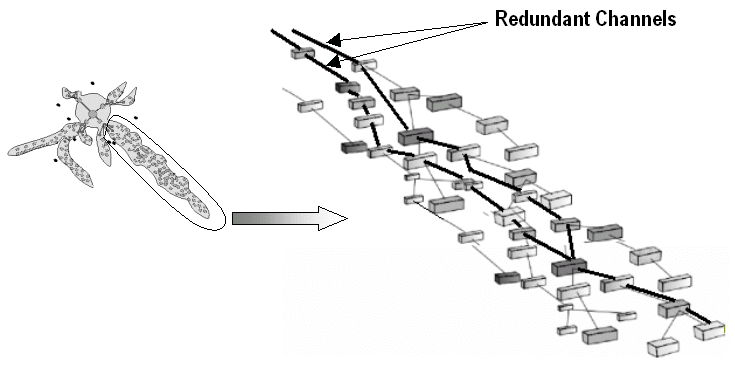
Graphic 9 is a visual picture of one tentacle of the compressed pyramid. It shows people linked by formal relations. Tracing these paths reveal that there are redundant paths. In other words, information flows are not confined to a single channel. This means that is unlikely (but not impossible for information to be blocked by a single person.
Graphic 9 - Tentacle Detail
 )
)
- View Highlight
-
Information flows have a purpose. They allow the firm to position itself to acquire input from the environment, or to more effectively "do its thing" (pursue the objectives for which it was formed). In other words, the information flows cause action.
- View Highlight
-
- [note::"Good information flow is a prerequisite for organizational excellence"]
(highlight:: Actions resulting from information flows can be seen as "moving" tentacles. Biologic organisms "move" in three-dimensional space. Organizational organisms "move" in other dimensions. These movements involve adjusting the firm's position relative to a factor or constituency on which the organization depends.
Although the concept of "movement" is an analogy, it is "real." The behavior of real people who make up the tentacle does change. The "inputs" available to the firm really do change. To some degree, the entire organization as an entity is affected. The concept of "movement" is an analogy, but one firmly founded on the concept of repositioning. This movement happens in an environment that the entity draws on for its sustenance. Both biological and organizational entities move. Only the dimensionality differs.)
- View Highlight
-
An example of a small shift in a tentacle is shown in Graphic 12. In this example, one function is substituted for another. This might be a firm dropping a Public Relations function and adding a Six-Sigma quality group. The tentacle shifts from a "customer" to a "product" dimension. There is no "visible" thing called a product dimension, but few firms would deny that it exists.
- View Highlight
-
Graphic 13 illustrates a large tentacle movement. This might be initiated by a policy shift. People might be asked to focus on a particular aspect of the environment. For example, a firm may decide to make "customer service" its highest value. If the initiative is successful, the firm's relationship with its customers will change. It has moved in its "customer" dimension.
- View Highlight
-
Any movement of a tentacle requires energy in the form of effort and/or money. The greater the movement, the greater the expenditure. In addition, movement can affect relations with other dimensions. For example, a movement in "product space" can attract some customers and repel others. Moving in "customer space" can reposition a firm in "governmental space" (e.g., taxes or regulation). Even the three-dimensional space of the biological organism can be affected as a firm grows or shrinks in terms of its physical space needs.
- View Highlight
-
The "I Opt" Map provides a tool for assessing the parts of a firm affected by a learning initiative. Consolidating the profiles of the people in affected units will provide a measure of how well a particular approach is likely to work. This knowledge can then be applied to improve learning outcomes.
- View Highlight
-
The forgoing application examples do not exhaust the potential for the "I Opt" Map. Change Management, Six-Sigma quality programs, and Succession Planning are only a few of the areas that might benefit from its use. The potential benefits are broad.
- View Highlight
-
The processes used to consolidate people into groups have been tested in thousands of cases involving real firms, real groups, and real organizational issues. The "I Opt" Map is not a speculative adventure. It is a realistic option.
- View Highlight
-
dg-publish: true
created: 2024-07-01
modified: 2024-07-01
title: The I-Opt Map
source: reader
@tags:: #lit✍/📰️article/highlights
@links::
@ref:: The I-Opt Map
@author:: oeinstitute.org
=this.file.name
Reference
=this.ref
Notes
An organization chart is the traditional tool for "seeing" a firm. A partial example of a set of charts is shown in Graphic 1. These charts are useful Human Resource records, but they fail as a way of assessing a firm as a whole. The webs of relationships existing between any two points in an organization are lost in the detail. The chart only describes the chain of command. The nature of the interactions up and down that chain is ignored.
- View Highlight
- 1idea, learning,
- [note::Org charts document chain of command. They do not document patterns of interactions (ideal or in actuality) or related concepts, such as power, influence, or collaborative excellence.
Could you use network aanaly]
- View Highlight
-
(highlight:: Graphic 2 - Symbolic Organizational Representation
)
- View Highlight
-
(highlight:: Graphic 3 - Solid Organizational Representation
)
- View Highlight
-
(highlight:: Graphic 5 - Collapsing the Pyramid
)
- View Highlight
-
(highlight:: Graphic 6 - Direct CEO Reports
)
- View Highlight
-
Not all of the CEO's direct reports "squirt" out the same distance. Some are close, some are far. The distance from the CEO is set by the frequency of interaction. The underlying idea is that a person cannot have an effect unless they have an opportunity to transmit their perspective. The more often they interact, the greater the opportunity.
- View Highlight
-
(highlight:: Graphic 7 - Second Level Reports
)
- View Highlight
-
(highlight:: Graphic 8 - Completed Compression
For example, the accounting staff lies toward the center of a tentacle. People in this function interact most often with other organizational insiders. The sales group, on the other hand, interacts with clients and has direct contact with the environment. Information flowing from people who lie on the edges (e.g., the sales group) are likely to contain raw data. It may be disjointe, but it is relatively without bias. People at the center of a tentacle (e.g., accountants) tend to use "second hand" data; however, because they are insulated from the turmoil of the environment, they can "digest" it into a focused and logical format. Recognizing the source and nature of this kind of difference can be important at both strategic and policy levels.)
- View Highlight
-
Graphic 9 is a visual picture of one tentacle of the compressed pyramid. It shows people linked by formal relations. Tracing these paths reveal that there are redundant paths. In other words, information flows are not confined to a single channel. This means that is unlikely (but not impossible for information to be blocked by a single person.
Graphic 9 - Tentacle Detail
)
- View Highlight
-
Information flows have a purpose. They allow the firm to position itself to acquire input from the environment, or to more effectively "do its thing" (pursue the objectives for which it was formed). In other words, the information flows cause action.
- View Highlight
-
- [note::"Good information flow is a prerequisite for organizational excellence"]
(highlight:: Actions resulting from information flows can be seen as "moving" tentacles. Biologic organisms "move" in three-dimensional space. Organizational organisms "move" in other dimensions. These movements involve adjusting the firm's position relative to a factor or constituency on which the organization depends.
Although the concept of "movement" is an analogy, it is "real." The behavior of real people who make up the tentacle does change. The "inputs" available to the firm really do change. To some degree, the entire organization as an entity is affected. The concept of "movement" is an analogy, but one firmly founded on the concept of repositioning. This movement happens in an environment that the entity draws on for its sustenance. Both biological and organizational entities move. Only the dimensionality differs.)
- View Highlight
-
An example of a small shift in a tentacle is shown in Graphic 12. In this example, one function is substituted for another. This might be a firm dropping a Public Relations function and adding a Six-Sigma quality group. The tentacle shifts from a "customer" to a "product" dimension. There is no "visible" thing called a product dimension, but few firms would deny that it exists.
- View Highlight
-
Graphic 13 illustrates a large tentacle movement. This might be initiated by a policy shift. People might be asked to focus on a particular aspect of the environment. For example, a firm may decide to make "customer service" its highest value. If the initiative is successful, the firm's relationship with its customers will change. It has moved in its "customer" dimension.
- View Highlight
-
Any movement of a tentacle requires energy in the form of effort and/or money. The greater the movement, the greater the expenditure. In addition, movement can affect relations with other dimensions. For example, a movement in "product space" can attract some customers and repel others. Moving in "customer space" can reposition a firm in "governmental space" (e.g., taxes or regulation). Even the three-dimensional space of the biological organism can be affected as a firm grows or shrinks in terms of its physical space needs.
- View Highlight
-
The "I Opt" Map provides a tool for assessing the parts of a firm affected by a learning initiative. Consolidating the profiles of the people in affected units will provide a measure of how well a particular approach is likely to work. This knowledge can then be applied to improve learning outcomes.
- View Highlight
-
The forgoing application examples do not exhaust the potential for the "I Opt" Map. Change Management, Six-Sigma quality programs, and Succession Planning are only a few of the areas that might benefit from its use. The potential benefits are broad.
- View Highlight
-
The processes used to consolidate people into groups have been tested in thousands of cases involving real firms, real groups, and real organizational issues. The "I Opt" Map is not a speculative adventure. It is a realistic option.
- View Highlight
-